2016 Election: Who Voted for Who?
December 2, 2016
This election has been a windy ride, but the results are in: Donald Trump will be the next President of the United States of America. Between the new wave of young voters, old voters, white and nonwhite voters, a small percentage of them took an exit poll to project how different groups of people voted, according to cnn.com.
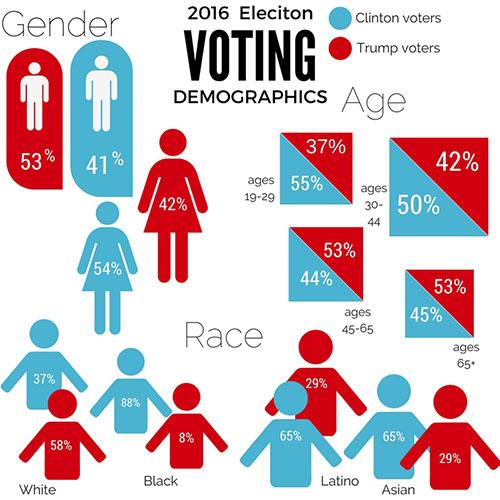
Gender-
Males: 41 percent Clinton, 53 percent Trump and 6 percent other or none.
Females: 54 percent Clinton, 42 percent Trump and 4 percent other or none.
Age-
18-29: 55 percent Clinton, 37 percent Trump, 8 percent other or none.
30-44: 50 percent Clinton, 42 percent Trump, 8 percent other or none.
45-65: 44 percent Clinton, 53 percent Trump, 3 percent other or none.
65 and older: 45 percent Clinton, 53 percent Trump, 2 percent other none.
Race-
White: 37 percent Clinton, 58 percent Trump, 5 percent other or none.
Black: 88 percent Clinton, 8 percent Trump, 4 percent other or none.
Latino: 65 percent Clinton, 29 percent Trump, 6 percent other or none.
Asian: 65 percent Clinton, 29 percent Trump, 6 percent other or none.
Other race: 56 percent Clinton, 37 percent Trump, 7 percent other or none.


